Palo Alto, CA land: flood, zoning and parcels
21,013 parcels
28% of Palo Alto’s 21,013 parcels are in a FEMA flood zone.
Map data Oct 11, 2026
- Acres on the roll14,878
- In a FEMA flood zone28%special flood hazard area
California 2026-27 taxes: bills go out by November 1; first installment due by December 10, 2026, second by April 12, 2027. Pay or check a bill at the Santa Clara County Department of Tax and Collections.
Free account: 25 parcel cards a day on the map, with watches and a saved search. Get started free
Around Palo Alto
Parcels to start with
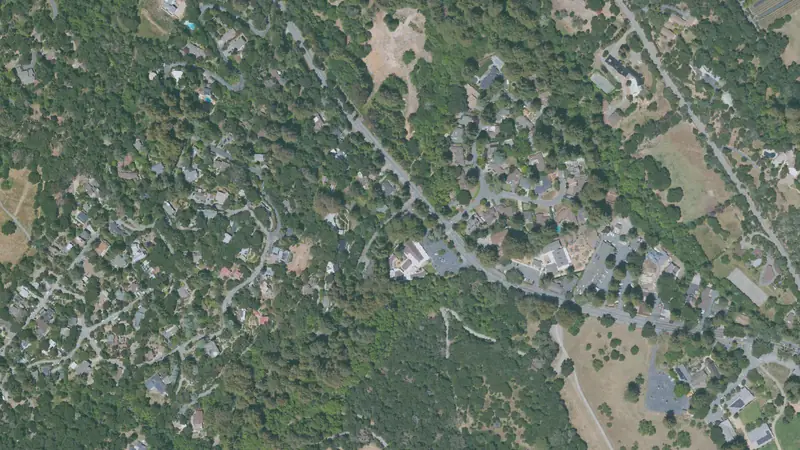
Flood zones and wetlands
Recorded flood claims in Palo Alto
Insured buildings in and around Palo Alto filed 483 flood claims since 1978; FEMA paid $9.3 million on them.
- 13% were on buildings rated outside the mapped flood zone (zone X, B or C)
- Largest single event: Pineapple Express - Southern (1998), 403 claims
| Years | Claims |
|---|---|
| 1978–79 | Fewer than 10 |
| 1980–89 | 28 |
| 1990–99 | 421 |
| 2000–09 | 11 |
| 2010–19 | Not shown |
| 2020–26 | 11 |
What flood insurance costs in Palo Alto
In and around Palo Alto, insured single-family homes in an A zone (special flood hazard area) pay about $970–$1,870 a year for flood insurance, and $850–$1,010 outside the mapped flood zone.
| Flood zone | Policies | Middle half | Full-risk median |
|---|---|---|---|
| A zones (special flood hazard area) | 1,595 | $970–$1,870 | $1,490 |
| X zone (outside the mapped flood zone) | 211 | $850–$1,010 | $1,530 |
Home value trend in Santa Clara County
Home values in Santa Clara County rose about 35% over 5 years and fell about 1% in the last year (FHFA, 2025).
Development in Palo Alto
About 14 acres inside Palo Alto's limits turned from farmland, forest or other open land into developed land in 2020–2025 (under 0.1% of its land), and about 34 acres in 2015–2025.
People and new homes in Palo Alto
About 67,609 people live in Palo Alto, and 214 new homes were permitted in 2025.
- Population67,609July 2025 estimate, −1.1% since 2020 (the whole city)
- Median household income$231,1012020–2024 average, ±$9,859
- New homes permitted2142025, 196 single-family; 129 in 2021
- Permitted so far in 2026313Jan–Aug, against 166 a year earlier
Typical lot sizeThe typical lot, from the roll
The median parcel in Palo Alto is 0.16 acre (19,187 parcels with a size).
Acres from the county roll, or from the parcel's own outline where the roll's figure is off by more than three times. Condominium units that share one point (each carrying the whole complex's acres) are left out of the lot sizes.
How Palo Alto is zonedThe most common districts
| Zoning district | Parcels | Share of zoned |
|---|---|---|
| R-1 | 11,025 | 52% |
| R-1 (8000) | 1,017 | 4.8% |
| R-1 (10000) | 1,011 | 4.8% |
| RM-20 | 933 | 4.4% |
| RM-30 | 851 | 4.1% |
| R-1 (S) | 470 | 2.2% |
| R-1 (7000) | 387 | 1.8% |
| R-2 | 374 | 1.8% |
Zoning is on file for 100% of parcels in Palo Alto, across 164 districts (the newest zoning map is dated Jul 2023; each parcel page gives its own map's date). A district shown by its code alone has no published name on our map. The town or county zoning office has the final word on any parcel.
Land parcels in Palo AltoFarm and timber parcels to start with
- 1901 Embarcadero Rd 606.4 acres
- 329.6 acres of land
- 303.6 acres of land
- 1723 Montebello Rd 248.0 acres
- 234.3 acres of land
- 208.6 acres of land
- 155.4 acres of land
- 151.2 acres of land
Farm parcels of an acre or more, each with its own page of public roll facts.
Nearby townsTowns around it
Questions about Palo Alto landAnswers from the public records
How many parcels are in Palo Alto, CA?
21,013 parcels on the Santa Clara County tax roll (as of Oct 2026) inside the Census Bureau's boundary for Palo Alto, which can differ from its own limits at the edges, covering 14,878 acres.
How much vacant land is in Palo Alto, CA?
Santa Clara County's tax roll codes little or no vacant land, so we do not count it here.
What is the typical lot size in Palo Alto?
The median parcel is 0.16 acre, from 19,187 parcels with a recorded size.
How much of Palo Alto is in a flood zone?
28% of parcels are in a FEMA special flood hazard area (National Flood Hazard Layer, as of Oct 2026). Check each parcel's own flood line before you buy.
Are there wetlands in Palo Alto?
0.3% of parcels are a quarter or more wetland on the USFWS National Wetlands Inventory, a mapping guide, not a legal delineation.
What is Palo Alto zoned?
Zoning is on file for 100% of parcels (zoning maps as of Jul 2023). The most common districts: R-1, R-1 (8000), R-1 (10000).
Are there land prices for Palo Alto?
No land-price range is shown for Palo Alto yet. We have no sale-price file for Santa Clara County yet.
How many people live in Palo Alto?
About 67,609 (Census estimate for July 1, 2025), −1.1% since 2020, counting the whole city.
How many new homes are being built in Palo Alto?
Building permits authorized 214 new housing units in 2025 and 313 from January to Aug 2026 (against 166 a year earlier) (Census Building Permits Survey).
Where does this data come from?
Parcels: County of Santa Clara. Flood: FEMA National Flood Hazard Layer. Wetlands: USFWS National Wetlands Inventory. Towns: U.S. Census places. Every figure is counted from those files on our map.
More in Santa Clara CountyIts other towns
Sources & methodSources, dates and how these figures are built
Headline figures: source and date
Acres on the roll: County tax roll, counted on our map built Oct 11, 2026.
In a FEMA flood zone: FEMA National Flood Hazard Layer, as of Oct 10, 2026; counted on our map built Oct 11, 2026.
Property tax due dates
California Revenue and Taxation Code 2617, 2618, 2619 and 1603; the State Board of Equalization’s 2026 appeal filing periods. Checked Oct 13, 2026.
Flood zones and wetlands: source and date
FEMA flood zone (A or V): FEMA National Flood Hazard Layer, as of Oct 10, 2026; counted on our map built Oct 11, 2026.
Parcels at least 25% wetland: USFWS National Wetlands Inventory, as of Oct 9, 2026; counted on our map built Oct 11, 2026.
Recorded flood claims in Palo Alto
Area statistics for buildings with NFIP flood insurance, not any one parcel: a lot that never had an insured building has no claims to count. Claims counted from 1978 to Sep 2026.
Source: OpenFEMA NFIP Redacted Claims v3, as of Sep 2026.
What flood insurance costs in Palo Alto
Middle half: the middle half of premiums on single-family NFIP policies that took effect Sep 2025–Sep 2026, by the flood zone each policy is rated in. It is what insured homes here pay, not a quote for any one building.
Full-risk median: the median of FEMA's own full-risk premium for the same policies (Risk Rating 2.0). A discounted policy rises toward it a step each year, within the law's cap on yearly increases.
Source: OpenFEMA NFIP Redacted Policies v3, as of Sep 2026.
Counted in the 47 census block groups that lie mostly inside Palo Alto, so the edges may reach past the town line.
Home value trend in Santa Clara County
This tracks home values, not land values. Land buyers read it as a sign of demand nearby: where homes gain value, builders and buyers follow. A vacant lot can move differently.
How: the change in FHFA's annual county index from 2020 and 2024 to 2025, rounded. The index follows repeat sales and refinance appraisals of the same single-family homes with Fannie Mae or Freddie Mac mortgages. It is in today's dollars, not adjusted for inflation, and FHFA calls these local indexes developmental. Where FHFA's sample is too small it publishes no figure, and none prints here.
Source: FHFA House Price Index, all-transactions, annual county index, 2025, last updated March 31, 2026. Method: Bogin, Doerner and Larson, “Local House Price Dynamics: New Indices and Stylized Facts”, FHFA Working Paper 16-01.
FHFA publishes no index for Palo Alto itself; this is Santa Clara County's, which includes it.
Development in Palo Alto
Counted inside the Census place boundary of Palo Alto city. Counted from USGS Annual NLCD land cover (2015, 2020 and 2025; 30 m squares on a 240 m grid, so edges are approximate). A square counts when it was forest, shrub, grassland, pasture, cropland or wetland in the start year and developed in 2025 (NLCD's developed classes, from lawns and roads to dense buildings). A satellite land-cover map misses some changes and mislabels a few; read it as a guide.
Source: USGS Annual NLCD Collection 1.2, public domain, DOI 10.5066/P94UXNTS.
People and new homes in Palo Alto
U.S. Census Bureau, Population Estimates Program, Vintage 2025 (May 2026); U.S. Census Bureau, American Community Survey 2020-2024 5-year (B19013) (Jan 2026); U.S. Census Bureau, Building Permits Survey (Sep 2026).
Sources
Parcels: County of Santa Clara (roll as of Oct 2026); flood: FEMA National Flood Hazard Layer (as of Oct 2026); wetlands: USFWS National Wetlands Inventory (as of Oct 2026); town limits: U.S. Census Bureau TIGER/Line places; counted on our map built Oct 2026.
This product uses the Federal Emergency Management Agency's OpenFEMA API, but is not endorsed by FEMA. The Federal Government or FEMA cannot vouch for the data or analyses derived from these data.