21.61–29.11 acres of farm and timber land near Boonville, Warrick County
Yankeetown Rd, Boonville, IN · Parcel 871302100001000003
2025 roll, county file September 2025 · before the 2026 roll
At a glance
- BuildZoning not on file
- Ground4% wetlands · soils very limited for septic
- ValueTax value $44.9k, 2025 roll · last sale Mar 2012
- Acres21.61County roll: 21.61 ac. Drawn outline measures 29.11 ac (county GIS, Sep 2025)
- Land typeFarm and timber
- ZoningWe have not collected a zoning map for City of Boonville yet
- Flood zoneX · minimal flood hazardFEMA flood map, as of Jul 2026
- Wetlands4% of the parcelUSFWS National Wetlands Inventory, as of Oct 2026
- Tax value (county)$44.9kAssessment, trended yearly; not a market price · 2025 roll
- Last saleMar 2012
- Road accessNo mapped roadNo public road on the map reaches the parcel line; the deed says how it is reached · Roads: Census TIGER/Line 2025 roads with IndianaMap road centerlines, Feb 2026
- City or townBoonville
Land facts
From public records and official maps, each with its source and date.
- Who zones itCity of Boonville
- Section, township, rangeSection 2, Township 6 South, Range 8 West, Second Principal MeridianBLM PLSS (CadNSDI), at the parcel's center · Oct 2026
- Septic (soils)Very limitedUSDA NRCS soil survey (SSURGO), septic absorption fields, version Aug 2026
- Nearest public wastewater plantAbout 1 mile (straight line) · Boonville Municipal WWTPEPA ECHO discharge permits for publicly owned treatment works, Oct 2026 · Not a sewer line at this lot. Plants that do not discharge to a river or stream (spray fields, percolation ponds) are not on EPA's list, so one could be closer
- Ground elevationAbout 393–400 ft above sea level; average slope 0.7% (flat)USGS 3DEP 1/3 arc-second (about 10 m), NAVD88; about ±1–2 ft · Oct 2026
- HighwaysState Rd 61 0.6 mi; I-69 interchange at State Rd 66 9.9 mi, in a straight lineCensus TIGER/Line 2025 roads with IndianaMap road centerlines · Feb 2026
- Nearest fire stationAbout 1.3 miles (straight line) · Boonville Fire DepartmentUSGS National Structures Dataset, fire and EMS stations, Oct 2026 · straight line, not road miles. Insurers' fire protection class (ISO) counts road miles to a responding station, often 5 or fewer. A station missing from the federal list would be closer
- Nearest emergency roomAbout 1.3 miles (straight line) · Ascension Saint Vincent Warrick HospitalCMS Care Compare hospital list (hospitals that report an emergency department), located by the U.S. Census Bureau geocoder, Jul 2026 · straight line, not road miles or drive time. Names as filed with Medicare. Veterans', military, children's and psychiatric hospitals are not counted
Services and surroundings
What serves the area around this parcel, from federal and state maps. Area facts, not a survey of the lot.
- USDA home loan areaInside an eligible areaHousehold income limits also apply. USDA Rural Development map, edited Jul 2023.
- Well depth nearbyMedian 90 ft (middle half 69–112 ft)From 7 well logs within 3 mi, drilled 1946–1981; water level 16 ft below ground; bedrock at 28 ft. Area figures, not this parcel. Indiana DNR well records.
- Public land nearbyScales Lake State Beach, 2 miCounty land, open to the public. 467 acres. Being nearby does not give access or hunting rights. USGS protected areas map (PAD-US 4.1).
School district and farmland
Public federal records, each with its source and date.
- School districtWarrick County School CorporationGrades K–12 · NCES EDGE school district boundaries, school year 2024–25 (Census TIGER 2025 lines), released Mar 2026. A district, not an assigned school
- Farmland classPrime farmland if drained and either protected from flooding or not frequently flooded during the growing seasonMap unit Bonnie silt loam, 0 to 2 percent slopes, frequently flooded, about 69% of the parcel · USDA NRCS soil survey (SSURGO), survey area IN173, version Aug 2026
- Crop productivity (NCCPI)0.72 of 1National Commodity Crop Productivity Index 3.0 of the main soil, Bonnie; higher is more productive for non-irrigated commodity crops · USDA NRCS soil survey (SSURGO), version Aug 2026
- Land capability classClass 3w of 8: severe limits for crops (excess water)Non-irrigated, Bonnie; class 1 has the fewest limits · USDA NRCS soil survey (SSURGO), version Aug 2026
- Cropland rent$175 an acre a yearCounty average, non-irrigated, 2026 · USDA NASS county cash rents survey, released August 21, 2026
District details at NCES: Warrick County School Corporation
Crops and forest
Public federal records, each with its source and year. Satellite classifications, not farm records.
- Crop history (CDL)2025 corn · 2024 soybeans · 2023 corn · 2022 soybeans · 2021 cornthe most common class in the 90 m around the parcel's map point, from satellite imagery; a classification, not a farm record · USDA NASS Cropland Data Layer 2021–2025
- Hydric soils65% of the parcelShare of the outline on soils rated hydric: the soil test of a wetland determination and of an NRCS wetland reserve easement (ACEP-WRE) · USDA NRCS soil survey (SSURGO)
- CRP rental rate (county)$193 an acre a yearThe county's 2026 average dryland soil rental rate (was $195): the base of a new Conservation Reserve contract's yearly rent; each field's rate follows its soils · USDA FSA, CRP 2026 county average soil rental rates
Soil for septic and building
Soils here are rated very limited for a septic drain field. They rate very limited for a house with or without a basement. The main soil shrinks and swells little as it wets and dries.
- Septic drain fieldVery limitedLimits: flooding, ponding, depth to saturated zone
- House, no basementVery limitedLimits: ponding, flooding, depth to saturated zone
- House with basementVery limitedLimits: ponding, flooding, depth to saturated zone
- Shrink-swellLowLinear extensibility about 1.5% at 10 to 39 in. deep
A soil-survey screening of the parcel's main soil, not a perc test. A septic permit needs the local health department's site evaluation, and a foundation design needs a soil test on the lot.
Utility service areas
Public service-area maps, each with its source and date. An area, not a connection at this parcel.
- Electric service areaInside the service area of CenterPoint Energy Indiana South (formerly Vectren)Investor-owned utility · IURC electric service territories map, edited Aug 2026: a visual aid, not the legal ruling.
- Water system areaInside the service area of City of Boonville (EPA modeled boundary)Public water system IN5287001 · EPA public water system service areas, edited May 2026: EPA modeled this boundary, which often differs from the actual one. Not a water line at the lot.
Environmental records
Public state and federal lists, each with its agency and date. Distances are from the parcel's map point; a record is not a finding about this parcel.
- Red flags10 environmental lists checked · landfills, voluntary cleanups and dry cleaners not checkedGroundwork check of public lists: Indiana Department of Environmental Management (IDEM), as of Apr 2026–Oct 2026; Indiana DNR Division of Oil and Gas / Indiana Geological and Water Survey, as of Jun 26, 2025; Indiana Geographic Information Office (from US EIA / DHS HIFLD), as of 2019; U.S. Fish and Wildlife Service, as of Aug 31, 2026; USGS Gap Analysis Project, as of 2025; U.S. EPA, as of Oct 15, 2026
- Oil and gas wellsNone within 1/4 mi of the parcel's map pointGroundwork check of public lists: Indiana DNR Division of Oil and Gas / Indiana Geological and Water Survey, as of Jun 26, 2025
Mapped ground hazards
Mapped features from IGWS maps, each with its agency and date. Distances are from the parcel's map point; a mapped area is not a finding about this parcel. Not checked here: surface coal mines, oil and gas wells, landslides.
- Underground coal mineNone mapped within 1/4 miIGWS: Underground coal mines (IDNR, December 2016), as of Dec 2016. Documented underground coal mines since the 1880s, from IDNR mine maps, to December 2016; outlines approximate
Free account: 25 parcel cards a day on the map, with watches and a saved search
 BoonvilleParcels and flood6.5%in a FEMA flood zone3,830parcels on the roll
Property tax
Indiana DLGF pay-2026 certified rates; DLGF 2025 real property roll, as of Oct 2026
- Tax rate
- 31.989 mills (Boonville City district: Warrick County, Boon Township, Boonville Civil City, Warrick County School Corporation, Boonville-Warrick County Public Library, Warrick County Solid Waste, pay 2026)
- Estimated annual tax
- ~$900Estimate before exemptions (homestead and other deductions, local income tax credits): the $44,900 gross assessed value × 31.989 mills; capped by the circuit breaker at 2% (residential / farmland) of $44,900
Pay or check a bill at the Warrick County Treasurer.
Value history
| Year | Land | Improvements | Total | Change |
|---|---|---|---|---|
| 2025 (pay 2026) | $44,900 | Not on the roll | $44,900 | -7.0% |
| 2024 (pay 2025) | $48,300 | Not on the roll | $48,300 | +20.1% |
Roll values set for property tax · Indiana DLGF parcel roll · as of Sep 2025
What land sells for nearby
Land in Warrick County sold for:
- 10 acres or more: $6.8k–$15.6k an acre (10 sales, Oct 2025–Sep 2026); median $10.2k
- Lots under 1 acre: $40k–$85k a lot (21 sales, Oct 2025–Sep 2026); median $57.5k
- 1 to 10 acres: $10.3k–$45.2k an acre (10 sales, Oct 2025–Sep 2026); median $34.2k
The middle half (25th to 75th percentile) and the median of recorded land sales (one parcel each, or one multi-parcel farm sale of bare land counted once). Each size uses its own months (the shortest of 12, 24 or 36 that holds enough sales), so the sizes' counts need not add up to another figure on this page. Source: STATS Indiana sales disclosure forms, valid for trending by the county assessor, vacant land with no improvement on the parcel at the sale; farm acreage (farm class, 10+ acres, no buildings): also the sales the assessor marked not valid for trending when the form gives none of the disqualifying answers (related parties, partial interest, court order, sheriff, quitclaim, trade, land contract and the like), because Indiana assessors do not trend farm sales; a multi-parcel farm sale of bare land counts once, at its price per total acre. Recorded sales, not an estimate of any parcel.
Home values in ZIP 47601 rose about 51% over 5 years and fell about 2% in the last year (FHFA, 2025).
Local jurisdictions
- Civil townshipBoon TownshipDLGF taxing districts (IGIO Taxing_Districts_2024) on the 2025 roll's district code · Jul 30, 2024
Owner: on the county assessment roll (not shown here) · Request removal
Hazards
FEMA National Risk Index for this census tract, not this parcel. As of Dec 2025.
- Tornado
- Relatively high
- Strong wind
- Relatively high
- Winter weather
- Relatively high
- Hail
- Relatively moderate
- Riverine flooding
- Relatively moderate
- Heat wave
- Relatively moderate
- Cold wave
- Relatively moderate
- Lightning
- Relatively moderate
- Earthquake
- Relatively moderate
- Drought
- Relatively low
- Wildfire
- Relatively low
- Landslide
- Very low
Recorded flood claims
OpenFEMA NFIP Redacted Claims v3, as of Sep 2026
- Claims since 1978
- Fewer than 10Insured buildings in this census tract
Federal disaster declarations
Federal disaster declarations in Warrick County since 2000: 15 (most recently Severe Winter Storm, January 2026).
- 7 severe storms
- 2 biological emergencies (COVID-19)
- 2 floods
- 1 hurricane
- 1 snowstorm
- 1 tornado
- 1 winter storm
Development nearby
About 7 acres within a mile turned from farmland, forest or other open land into developed land in 2020–2025 (more than most of Warrick County).
- 2020–2025
- About 7 acresWithin a mile, open land turned developed
- 2015–2025
- About 10 acresThe same, over 10 years
- Typical in Warrick County
- About 6 acresThe middle of the county's land, 2020–2025
Neighborhood (Census)
Census ACS 2020–2024 5-year, as of Jan 2026
- Median household income
- $99,696± $43,583
- Median home value (owner-reported)
- $213,300± $27,688 · census tract (block group sample too small)
- Median rent (gross)
- $854± $8
- Homes lived in by their owners
- 82%± 13 pts
- Median year homes were built
- 1985± 9 yr
- Average commute (one way)
- 26 min± 6 min · census tract (not published for block groups)
- Population
- 1,346± 387
Figures for the census block group around this parcel (a few hundred homes), not this property. This product uses Census Bureau data but is not endorsed or certified by the Census Bureau.
Nearby parcels
Land and farm parcels of 1 acre or more in Warrick County, nearest first.
- 2.59 acres of residential land near Boonville0.1 mi
- 115 Owensboro Rd2.5 acres · Residential lot · 0.8 mi
- 205 E Columbia3.94 acres · Residential lot · 0.8 mi
- 2355 Huffman Rd6.82 acres · Residential lot · 1.3 mi
- 988 Pelzer Rd3.36 acres · Residential lot · 1.6 mi
- 1999 S Yankeetown Rd15 acres · Residential lot · 1.6 mi
- 422 Geneva Way2.74 acres · Residential lot · 1.7 mi
- 331 Rockport Rd2.71 acres · Residential lot · 1.7 mi
Land and farm parcels of 1 acre or more in Warrick County: 2,110 parcel pages
Sources & methodSources, county file September 2025
At a glance: each fact's source and date
Each figure in the grid above, where it comes from and the date of the file or map we read.
Acres: Indiana DLGF parcel roll (Indiana Gateway) and IGIO statewide parcel boundaries, county file Sep 1, 2025.
Land type: Indiana DLGF parcel roll (Indiana Gateway) and IGIO statewide parcel boundaries, county file Sep 1, 2025.
Zoning: Our zoning map coverage, map built Oct 11, 2026.
Flood zone: FEMA National Flood Hazard Layer, as of Jul 11, 2026.
Wetlands: USFWS National Wetlands Inventory, as of Oct 1, 2026.
Tax value (county): Indiana DLGF parcel roll (Indiana Gateway) and IGIO statewide parcel boundaries, county file Sep 1, 2025.
Last sale: Indiana DLGF parcel roll (Indiana Gateway) and IGIO statewide parcel boundaries, sales through May 21, 2026.
Road access: No public road on the map reaches the parcel line; the deed says how it is reached · Roads: Census TIGER/Line 2025 roads with IndianaMap road centerlines, Feb 2026.
City or town: DLGF taxing districts, as of Jul 30, 2024.
Soil for septic and building
Source: USDA NRCS soil survey (SSURGO), survey area IN173, version Aug 2026, read through NRCS Soil Data Access.
The parcel's main soil map unit covers about 69% of its outline: Bonnie silt loam, 0 to 2 percent slopes, frequently flooded. Its main component is Bonnie (90% of the unit).
The ratings are NRCS's own map-unit interpretations (dominant condition): ENG - Septic Tank Absorption Fields, ENG - Dwellings W/O Basements and ENG - Dwellings With Basements. The limits listed are the features NRCS names for the main component. Shrink-swell is that component's linear extensibility, depth-weighted from 25 to 100 cm, the layer NRCS's homesite rule reads; NRCS classes: low under 3%, moderate 3 to 6%, high 6 to 9%, very high 9% or more.
A screening, not a perc test or a soil boring: soils vary inside a map unit (survey scale about 1:12,000 to 1:24,000), and fill or grading may have changed the lot.
Property tax
Rates: Indiana DLGF, pay 2026. The estimate is the county's taxable value times those rates, before exemptions; it is not a bill. The county treasurer's bill is the official figure.
Property tax · Due dates
Indiana pay-2026 taxes: second installment due November 10, 2026.
Sources: Indiana Code 6-1.1-22-9 and 6-1.1-15-1.1; the Department of Local Government Finance due dates. Checked Oct 13, 2026.
What land sells for nearby
This tracks home values, not land values. Land buyers read it as a sign of demand nearby: where homes gain value, builders and buyers follow. A vacant lot can move differently.
How: the change in FHFA's annual five-digit ZIP code index from 2020 and 2024 to 2025, rounded. The index follows repeat sales and refinance appraisals of the same single-family homes with Fannie Mae or Freddie Mac mortgages. It is in today's dollars, not adjusted for inflation, and FHFA calls these local indexes developmental. Where FHFA's sample is too small it publishes no figure, and none prints here.
Source: FHFA House Price Index, all-transactions, annual five-digit ZIP code index, 2025, last updated March 31, 2026. Method: Bogin, Doerner and Larson, “Local House Price Dynamics: New Indices and Stylized Facts”, FHFA Working Paper 16-01.
Hazards
Ratings come from FEMA's National Risk Index (v1.20, planning-level) and the public federal and state maps named on each row, not a private climate model. FEMA rates each census tract from expected annual losses, community resilience and social vulnerability, for planning; it is not an assessment of this parcel.
Recorded flood claims
Insured buildings near this parcel, not the parcel itself. FEMA counts claims on buildings with NFIP flood insurance, so land that never had an insured building has no claims to count. The count is the parcel's census block group when it has 10 or more, else its tract's; a count under 10 prints as "Fewer than 10". Source: OpenFEMA NFIP Redacted Claims v3.
Federal disaster declarations
Each federal declaration whose designated areas include the county, declared from January 2000 on, counted once by its FEMA disaster number. An emergency declaration and a major-disaster declaration for the same storm are two declarations, as FEMA numbers them. Declarations for tribal lands alone are not counted. The date shown is when the most recent incident began. Types are FEMA's incident types: an evacuation emergency for a storm elsewhere (Hurricane Katrina, 2005) counts under that storm. By kind: 11 major disasters and 4 emergencies.
Source: FEMA, OpenFEMA Dataset: Disaster Declarations Summaries - v2, as of October 2026. This product uses the Federal Emergency Management Agency's OpenFEMA API, but is not endorsed by FEMA. The Federal Government or FEMA cannot vouch for the data or analyses derived from these data.
Development nearby
Counted from USGS Annual NLCD land cover (USGS Annual NLCD Collection 1.2, 30 m maps made from Landsat imagery, 2015, 2020 and 2025; public domain, DOI 10.5066/P94UXNTS). A 30 m square counts when it was forest, shrub, grassland, pasture, cropland or wetland in the start year and developed in 2025: NLCD's developed classes, from lawns, parks and roads to dense buildings. The squares are summed over the land within about a mile of this parcel's center on a 240 m grid, so the figures are rounded. "Most of the county" compares the same one-mile figure across the county's land. A satellite land-cover map misses some changes and mislabels a few, so read it as a guide to how fast the area is building out, not a survey. As of 2025 land cover.
Neighborhood (Census)
± is the Census 90% margin of error; a figure comes from the larger census tract when the block group's sample is too small.
Tax value
Tax value: the county's yearly assessment (gross assessed value, trended every year), not a market price. County file, September 2025.
Gross assessed value (the county assessor's market value-in-use, trended every year), not a market estimate. Farmland is assessed by the state's base-rate formula, well below what farmland sells for.
Parcel outline
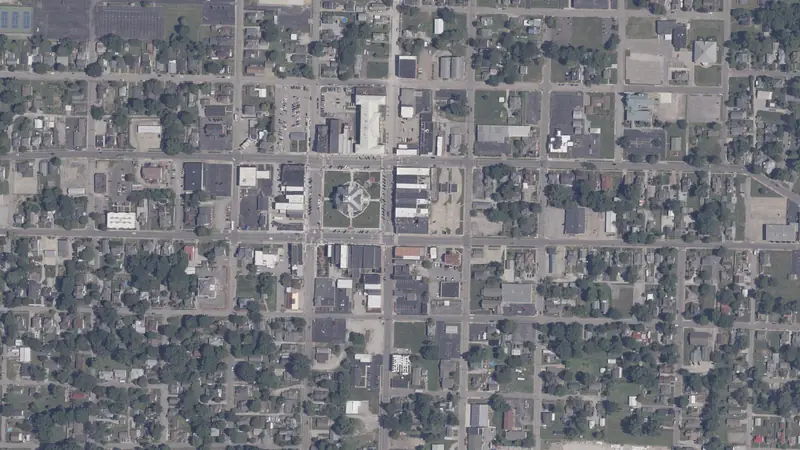
The outline and its edge lengths are measured on the parcel map the map draws; the aerial loads from the public imagery named under it.
Source
Indiana DLGF parcel roll (Indiana Gateway) and IGIO statewide parcel boundaries, county file Sep 1, 2025.
Record
Public records can be wrong; check before you act.
Parcel: 871302100001000003
Coordinates: 38.0283° N, 87.2802° W