Home on 10.51 acres near Milton, Santa Rosa County
Last sold Oct 2016 for $250k; public road frontage on Allie Rae St.
5550 Allie Rae St, Milton, FL · Parcel 36-2N-29-0000-01820-0000
County roll Jan 1, 2026 · Map data Nov 1, 2026
At a glance
- BuildZoning AG-RR allows single-family homes · 2 buildings already on the lot
- Ground~10.36 of 10.51 ac outside mapped wetlands and floodway · 1% wetlands · soils very limited for septic; a septic system on record
- AccessFronts a public road
- NearbyOff-water vacant land in Milton, all sizes: $18k an acre median, 90 sales
- Home4,595 sq ft · built 1995Living area of all buildings on the parcel
- Acres10.51~10.36 of 10.51 ac outside mapped wetlands and floodway
- Land typeHomeSingle-family home
- ZoningAG-RRRural residential agriculture
- Future land useAG-RRAgriculture rural residential
- Flood zoneXMinimal flood hazard
- Wetlands1% of the parcelNational Wetlands Inventory: wetlands, ponds, lakes and rivers
Land facts
From public records and official maps, each with its source and date.
- City limitsUnincorporated Santa Rosa County: county zoning and permits applySanta Rosa County zoning map · Nov 2026
- Section, township, rangeSection 36, Township 2 North, Range 29 West, Tallahassee MeridianSanta Rosa County parcel number · 2026 roll
- Allowed usesSingle-family homes, farmingSanta Rosa County land development code, LDC Tables 2.05.01.a, 2.06.01.a · Sep 2026
- Impact feesCharged on a new single-family homeSanta Rosa fee schedule · Jan 2026
- SewerSeptic system on recordFL DOH Water Management Inventory (2009)
- WaterPublic (City of Milton)FL DOH Water Management Inventory
- Nearest public wastewater plantAbout 4 miles (straight line) · Milton WWTFEPA ECHO discharge permits for publicly owned treatment works, Oct 2026 · Not a sewer line at this lot. Plants that do not discharge to a river or stream (spray fields, percolation ponds) are not on EPA's list, so one could be closer
- SoilsDothan fine sandy loam, 2 to 5 percent slopes, on 62% of the parcelSoils rate very limited for septic · USDA soil survey (SSURGO) · Nov 2026
- Ground elevationAbout 80–109 ft above sea levelUSGS 3DEP 1/3 arc-second (about 10 m), NAVD88; about ±1–2 ft · Nov 2026
- HighwaysUS 90 is 2.4 mi away and I-10 exit 26 is 6.2 mi away, in a straight lineOpenStreetMap roads · Nov 2026
- Nearest fire stationAbout 0.6 miles (straight line) · Skyline Volunteer Fire and Rescue Department 22 Substation 3USGS National Structures Dataset, fire and EMS stations, Oct 2026 · straight line, not road miles. Insurers' fire protection class (ISO) counts road miles to a responding station, often 5 or fewer. A station missing from the federal list would be closer
- Nearest emergency roomAbout 1.9 miles (straight line) · Santa Rosa Medical CenterCMS Care Compare hospital list (hospitals that report an emergency department), located by the U.S. Census Bureau geocoder, the USGS building or the county parcel record, Jul 2026 · straight line, not road miles or drive time. Names are the hospital's Medicare listing or its building name on the USGS map. Veterans', military, children's and psychiatric hospitals are not counted
- Nearest public schoolsBerryhill Elementary School, about 1.2 miles · Hobbs Middle School, about 2.1 miles · Milton High School, about 3.3 miles (straight line)NCES public school locations (EDGE), school year 2024-25; updated with the NCES 2025-26 preliminary directory (openings, closings, grades and names); a school new in 2025-26 is placed at its NCES 2024-25 point, a Census Bureau geocoder match or the county parcel at its address, and a level is left out where a new school with no known location could be nearer · straight line from the parcel's map point, not road miles. The nearest school is not necessarily the one a home here is zoned for. The school district sets attendance zones, so check with the district. Regular public schools only; charter, online and alternative schools are not counted
- Evacuation and surgeNot in an evacuation zone or a storm surge zoneFDEM Know Your Zone evacuation zones · Sep 2026; FDEM storm surge zones (SRES) · May 2022
- Design wind speed151 mph; wind-borne debris regionNIST WindMaps ASCE 7-22 Risk Category II (FBC 2023) via Palm Beach County GIS · Dec 2023
- Just value per acre$35k an acreJust value $367k over 10.51 acres · 2026 roll
Legal description and record
- Parcel number36-2N-29-0000-01820-0000Santa Rosa County Property Appraiser's record number · state roll: 362N290000018200000
- Legal descriptionCOM SE CORN THN N2*50 31 E 994Florida DOR tax roll · 2026 roll · the roll keeps 30 characters; the deed has it all
- Lot dimensionsSides 1,004, 512 and 491 ftCounty parcel map outline · Nov 2026
Services and surroundings
What serves the area around this parcel, from federal and state maps. Area facts, not a survey of the lot.
- USDA home loan areaInside an eligible areaHousehold income limits also apply. USDA Rural Development map, edited Jul 2023.
- Public land nearbyCommunity Center & Park, 2.8 miCity land, open to the public. 52 acres. Being nearby does not give access or hunting rights. USGS protected areas map (PAD-US 4.1).
School district and farmland
Public federal records, each with its source and date.
- School districtSanta Rosa County School DistrictGrades pre-K–12 · NCES EDGE school district boundaries, school year 2024–25 (Census TIGER 2025 lines), released Mar 2026. A district, not an assigned school
- Farmland classAll areas are prime farmlandMap unit Dothan fine sandy loam, 2 to 5 percent slopes, about 62% of the parcel · USDA NRCS soil survey (SSURGO), survey area FL113, version Sep 2026
- Crop productivity (NCCPI)0.55 of 1National Commodity Crop Productivity Index 3.0 of the main soil, Dothan; higher is more productive for non-irrigated commodity crops · USDA NRCS soil survey (SSURGO), version Sep 2026
- Land capability classClass 2e of 8: moderate limits for crops (erosion)Non-irrigated, Dothan; class 1 has the fewest limits · USDA NRCS soil survey (SSURGO), version Sep 2026
District details at NCES: Santa Rosa County School District
Crops and forest
Public federal records, each with its source and year. Satellite classifications, not farm records.
The satellite crop map shows no cropland on this parcel in 2021–2025; its largest cover in 2025 was grass or pasture.
- Cropland (CDL)None mappedSatellite-classified cultivated land over the parcel outline, not FSA field records · USDA NASS Cropland Data Layer 2021–2025
- Land cover 2025 (CDL)Grass or pasture 5.8 ac, developed (open space) 2 ac, developed (low intensity) 2 acThe outline's main covers in 2025, crops included · USDA NASS Cropland Data Layer 2025
- Hydric soilsNone mappedShare of the outline on soils rated hydric: the soil test of a wetland determination and of an NRCS wetland reserve easement (ACEP-WRE) · USDA NRCS soil survey (SSURGO)
Soil for septic and building
Soils here are rated very limited for a septic drain field. They rate not limited for a house without a basement and somewhat limited for one with a basement. The main soil shrinks and swells little as it wets and dries.
- Septic drain fieldVery limitedLimits: slow water movement, depth to saturated zone
- House, no basementNot limited
- House with basementSomewhat limitedLimit: depth to saturated zone
- Shrink-swellLowLinear extensibility about 0.9% at 10 to 39 in. deep
A soil-survey screening of the parcel's main soil, not a perc test. A septic permit needs the local health department's site evaluation, and a foundation design needs a soil test on the lot.
Free account: this parcel’s sale history
 MiltonLand prices, flood and zoning$25kan acre, 2-year median4,919vacant parcels14%in a FEMA flood zone
Road access
- Has road access OpenStreetMap roads
- Road frontage
- On Allie Rae St The length is not shown
Home facts
Florida Department of Revenue tax roll · 2026
- Building type
- Single-family
- Bedrooms and bathrooms
- Not on Florida's statewide tax roll
- Living area
- 4,595 sq ft total living area
- Year built
- 1995
- Buildings
- 2
Property tax
Florida Department of Revenue tax roll and millage rates (Data Book), as of Nov 2025
- Property tax (2025)
- At least $1,800 Taxable value $171,670 for school levies and $145,948 for other levies on the 2025 roll, after the homestead exemption
Pay or check a bill at the Santa Rosa County Tax Collector.
Hazards
FEMA National Risk Index for this census tract, not this parcel. As of Dec 2025.
- Lightning
- Very high
- Hurricane
- Relatively high
- Tornado
- Relatively high
- Heat wave
- Relatively moderate
- Strong wind
- Relatively low
- Coastal flooding
- Very low
- Earthquake
- Very low
- Landslide
- Very low
Recorded flood claims
OpenFEMA NFIP Redacted Claims v3, as of Sep 2026
- Claims since 1978
- 13 Insured buildings in this census block group
- Outside the mapped flood zone
- Fewer than 10 Rated zone X, B or C
Federal disaster declarations
Federal disaster declarations in Santa Rosa County since 2000: 32 (most recently Hurricane Isaias, October 2026).
- 20 hurricanes
- 5 severe storms
- 4 tropical storms
- 2 biological emergencies (COVID-19)
- 1 fire
Development nearby
About 65 acres within a mile turned from farmland, forest or other open land into developed land in 2020–2025 (among the most in Santa Rosa County).
- 2020–2025
- About 65 acres Within a mile, open land turned developed
- 2015–2025
- About 95 acres The same, over 10 years
- Typical in Santa Rosa County
- Under 5 acres The middle of the county's land, 2020–2025
Value history
| Year | Land | Improvements | Just value | Change |
|---|---|---|---|---|
| 2026 (preliminary) | $119,166 | $248,268 | $367,434 | +12.0% |
| 2025 | $105,942 | $222,085 | $328,027 | +4.2% |
Roll values set for property tax · Florida Department of Revenue tax roll (NAL) · 2026
Home values in Santa Rosa County rose about 53% over 5 years and 1% in the last year (FHFA, 2025).
Vacant land prices nearby
$18k per acre
Median of 90 sales of off-water vacant land in Milton, all sizes, Nov 2023–May 2026
Sales area: Milton
| Land type | Median | Middle half |
|---|---|---|
| Off-water vacant land in Milton, all sizes | $18k/ac | $13.1k–$30.5k |
Nearby
Neighborhood (Census)
Census ACS 2020–2024 5-year, as of Jan 2026
- Median household income
- $96,353 ± $23,284
- Median home value (owner-reported)
- $340,700 ± $39,995
- Median rent (gross)
- $1,679 ± $199 · census tract (block group sample too small)
- Homes lived in by their owners
- 66% ± 10 pts
- Median year homes were built
- 2003 ± 6 yr
- Average commute (one way)
- 28 min ± 9 min · census tract (not published for block groups)
- Population
- 2,689 ± 854
Figures for the census block group around this parcel (a few hundred homes), not this property. This product uses Census Bureau data but is not endorsed or certified by the Census Bureau.
Nearby homes
- 5538 Allie Rae StHome, 4 acresunder 0.1 mi
- 5556 Allie Rae StHome, 5.09 acresunder 0.1 mi
- 5578 Allie Rae StHome, 5.23 acres0.1 mi
- 5613 Doris StHome, 2.87 acres0.2 mi
- 5422 Whisper LnHome, 0.77 acres0.2 mi
- 5630 Henley RdHome, 7 acres0.2 mi
Sources & methodSources, dates and how the estimates are tested
At a glance: each fact's source and date
Each figure in the grid above, where it comes from and the date of the file or map we read.
Acres: Santa Rosa County tax roll (Florida Department of Revenue), 2026 roll.
Land type: Santa Rosa County tax roll (Florida Department of Revenue), 2026 roll.
Zoning: Santa Rosa County zoning map, map built Nov 1, 2026.
Future land use: Santa Rosa County land-use map, map built Nov 1, 2026.
Flood zone: FEMA flood map, as of Sep 2026.
Wetlands: USFWS National Wetlands Inventory, as of Sep 2026.
Just value (county): Santa Rosa County tax roll (Florida Department of Revenue), 2026 roll.
Last sale: Santa Rosa County deed record, recorded Oct 2016.
Crops and forest
Source: USDA NASS Cropland Data Layer, 2021–2025 (USDA National Agricultural Statistics Service; 30 m satellite classification; public domain).
How: we count the 30 m cells whose centres fall inside the parcel outline, class by class and year by year, and scale the counts to the outline's acres.
Cropland means CDL cultivated land: cells in a cultivated class in at least 2 of the 5 years, or in the latest year, the rule NASS uses for its Cultivated Layer. Fallow and idle cropland counts; hay other than alfalfa, pasture, grass and forest do not. Where a listing would say tillable acres, this figure means CDL cultivated land only: it is not a survey, a farm's reported acres or USDA FSA field (CLU) records, which are not public.
Limits: NASS puts the accuracy of the major crops at about 85 to 95%. Field edges, roads, farmsteads and small patches are often misclassed, so any parcel's figures can be off by a few acres. The rotation names the largest crop each year; a year counts as cropped with crops on at least 10% of the parcel or on 5 acres or more, and no rotation is named when cropland is under 10% of the parcel. Acres are shares of the parcel's acres on this page; where the parcel outline and those acres differ by more than 20%, this read is not shown.
Soil for septic and building
Source: USDA NRCS soil survey (SSURGO), survey area FL113, version Sep 2026, read through NRCS Soil Data Access.
The parcel's main soil map unit covers about 62% of its outline: Dothan fine sandy loam, 2 to 5 percent slopes. Its main component is Dothan (83% of the unit).
The ratings are NRCS's own map-unit interpretations (dominant condition): ENG - Septic Tank Absorption Fields, ENG - Dwellings W/O Basements and ENG - Dwellings With Basements. The limits listed are the features NRCS names for the main component. Shrink-swell is that component's linear extensibility, depth-weighted from 25 to 100 cm, the layer NRCS's homesite rule reads; NRCS classes: low under 3%, moderate 3 to 6%, high 6 to 9%, very high 9% or more.
A screening, not a perc test or a soil boring: soils vary inside a map unit (survey scale about 1:12,000 to 1:24,000), and fill or grading may have changed the lot.
Property tax
A minimum: the county-wide and city rates the state publishes times the roll's taxable value. The bill also carries the levies this figure leaves out; the county's bill is the official figure. Excludes levies on part of the county (fire, library and other special districts, unincorporated-area MSTUs) and non-ad valorem assessments.
Property tax · Due dates
Florida 2026 taxes: 4% discount if paid in November; due by March 31, 2027.
Sources: Florida Statutes 197.162, 197.333, 197.222 and 194.011. Checked Oct 13, 2026.
Hazards
Ratings come from FEMA's National Risk Index (v1.20, planning-level) and the public federal and state maps named on each row, not a private climate model. FEMA rates each census tract from expected annual losses, community resilience and social vulnerability, for planning; it is not an assessment of this parcel.
Recorded flood claims
Insured buildings near this parcel, not the parcel itself. FEMA counts claims on buildings with NFIP flood insurance, so land that never had an insured building has no claims to count. The count is the parcel's census block group when it has 10 or more, else its tract's; a count under 10 prints as "Fewer than 10". Source: OpenFEMA NFIP Redacted Claims v3.
Federal disaster declarations
Each federal declaration whose designated areas include the county, declared from January 2000 on, counted once by its FEMA disaster number. An emergency declaration and a major-disaster declaration for the same storm are two declarations, as FEMA numbers them. Declarations for tribal lands alone are not counted. The date shown is when the most recent incident began. Types are FEMA's incident types: an evacuation emergency for a storm elsewhere (Hurricane Katrina, 2005) counts under that storm. By kind: 18 major disasters, 13 emergencies and 1 fire-management declaration.
Source: FEMA, OpenFEMA Dataset: Disaster Declarations Summaries - v2, as of October 2026. This product uses the Federal Emergency Management Agency's OpenFEMA API, but is not endorsed by FEMA. The Federal Government or FEMA cannot vouch for the data or analyses derived from these data.
Development nearby
Counted from USGS Annual NLCD land cover (USGS Annual NLCD Collection 1.2, 30 m maps made from Landsat imagery, 2015, 2020 and 2025; public domain, DOI 10.5066/P94UXNTS). A 30 m square counts when it was forest, shrub, grassland, pasture, cropland or wetland in the start year and developed in 2025: NLCD's developed classes, from lawns, parks and roads to dense buildings. The squares are summed over the land within about a mile of this parcel's center on a 240 m grid, so the figures are rounded. "Most of the county" compares the same one-mile figure across the county's land. A satellite land-cover map misses some changes and mislabels a few, so read it as a guide to how fast the area is building out, not a survey. As of 2025 land cover.
Value history
This tracks home values, not land values. Land buyers read it as a sign of demand nearby: where homes gain value, builders and buyers follow. A vacant lot can move differently.
How: the change in FHFA's annual county index from 2020 and 2024 to 2025, rounded. The index follows repeat sales and refinance appraisals of the same single-family homes with Fannie Mae or Freddie Mac mortgages. It is in today's dollars, not adjusted for inflation, and FHFA calls these local indexes developmental. Where FHFA's sample is too small it publishes no figure, and none prints here.
Source: FHFA House Price Index, all-transactions, annual county index, 2025, last updated March 31, 2026. Method: Bogin, Doerner and Larson, “Local House Price Dynamics: New Indices and Stylized Facts”, FHFA Working Paper 16-01.
Neighborhood (Census)
± is the Census 90% margin of error; a figure comes from the larger census tract when the block group's sample is too small.
10.51-acre improved parcel in Milton, Santa Rosa County: zoned AG-RR, about 10.36 of 10.51 acres outside mapped wetlands and floodway, FEMA zone X, 1% wetlands; off-water vacant land in Milton, all sizes, sold for an $18k per acre median (90 sales, Nov 2023–May 2026). Map data as of Nov 1, 2026.
Land prices
Latest arm's-length sale per vacant parcel (parcels of ¾ acre or more, priced per acre), last three years.
Sources
Public county records: the tax roll, GIS zoning and land use, FEMA flood zones and USFWS wetlands. Map data as of Nov 1, 2026.
Parcel outline
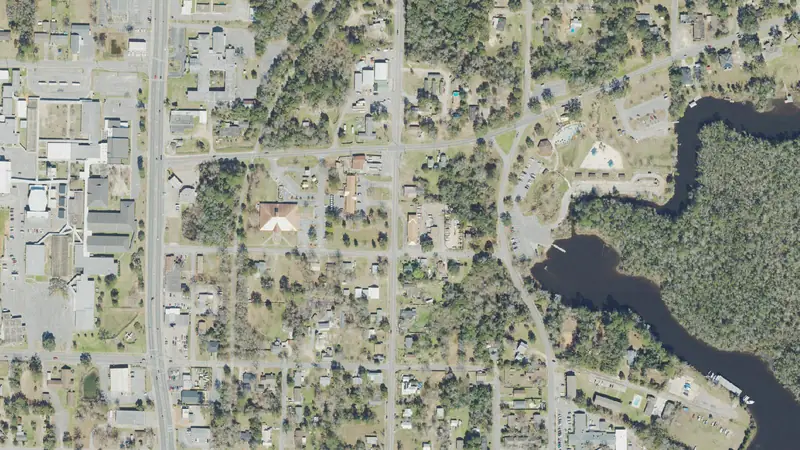
The outline and its edge lengths are measured on the county parcel map the map draws; the aerial loads from the public imagery named under it.
Record
Public records can be wrong; check before you act.
Parcel: 36-2N-29-0000-01820-0000
Coordinates: 30.6385° N, 87.0992° W
Estimates for your own analysis, not an appraisal or a broker price opinion.
Owners
Your land? Ask us to hide your name: confidential records right away, other requests within five business days.