Groundwork · Florida · latest edition Q2 2026 · checked Oct 15, 2026
Florida vacant land prices by county
What vacant land sold for in each Florida county in Q2 2026 (Apr–Jun 2026), from recorded sales. In the 28 counties whose quarter is fully recorded, land of 1 acre or more sold for a median $27.1k an acre, −2% on Q2 2025. This page always shows the newest quarterly edition; every edition keeps its own dated page, listed below.
Download the table (CSV)Share imageMonthly market report
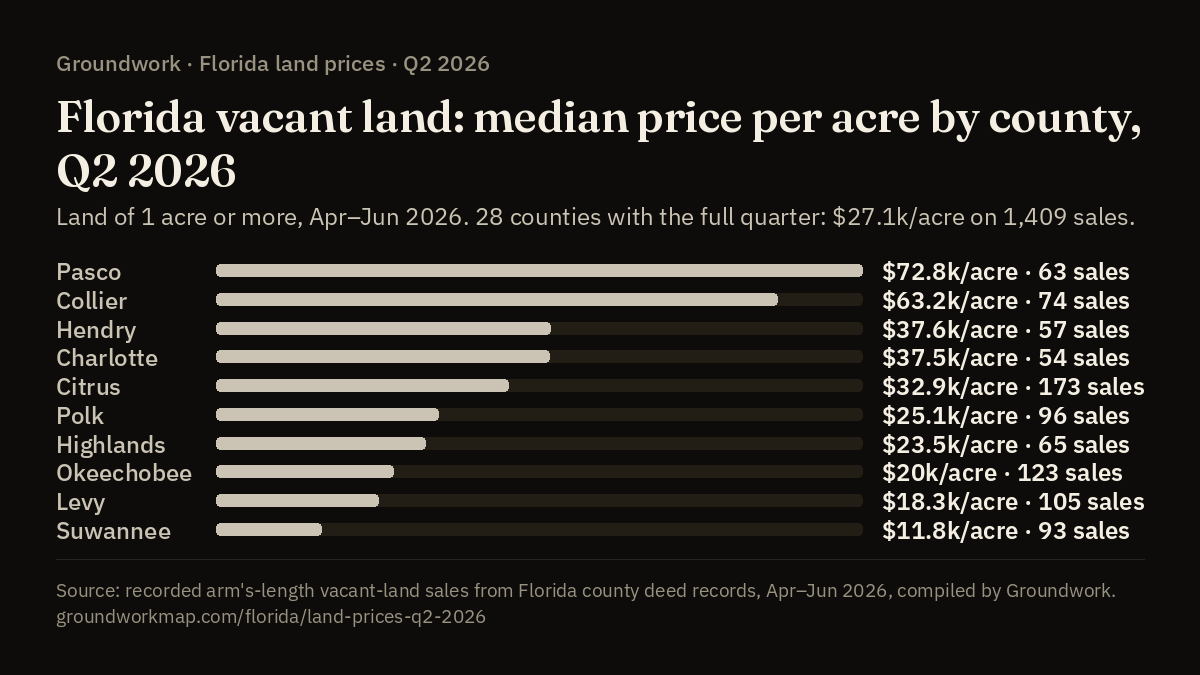
Biggest moves on the year
Median Q2 2026 against Q2 2025, counties with 30 or more sales in both.
| County | Land | Q2 2025 | Q2 2026 | Change | Sales |
|---|---|---|---|---|---|
| Escambia | 1+ acre, per acre | $10.7k | $25.7k | +140% | 31 → 33 |
| Pasco | Lots, per lot | $35k | $75.7k | +116% | 99 → 134 |
| Collier | Lots, per lot | $735k | $278k | −62% | 57 → 38 |
| Duval | 1+ acre, per acre | $108k | $57.3k | −47% | 34 → 31 |
| Hillsborough | Lots, per lot | $217k | $126k | −42% | 95 → 86 |
| Walton | 1+ acre, per acre | $28.3k | $17.3k | −39% | 62 → 46 |
| Pinellas | Lots, per lot | $410k | $250k | −39% | 149 → 101 |
| Alachua | 1+ acre, per acre | $21.6k | $28.7k | +33% | 42 → 47 |
Every county
Q2 2026, Apr–Jun 2026. A dash: too few sales for the rule under Method.
| County | Per acre, 1+ acre | Sales | vs Q1 2026 | vs Q2 2025 | Per lot, under 1 acre | Sales | vs Q2 2025 |
|---|---|---|---|---|---|---|---|
| Alachua | $28.7k | 47 | +17% | +33% | $33.8k | 32 | — |
| Baker | Sales recorded through Apr 2026 | ||||||
| Bay | $20k | 43 | −26% | −30% | $50k | 147 | −11% |
| Bradford | Sales recorded through May 2026 | ||||||
| Brevard | Sales recorded through May 2026 | ||||||
| Broward | Sales recorded through May 2026 | ||||||
| Calhoun | $8,000 | 11 | — | — | — | 2 | — |
| Charlotte | $37.5k | 54 | −17% | −12% | $20k | 767 | 0% |
| Citrus | $32.9k | 173 | −5% | +1% | $18.5k | 413 | −7% |
| Clay | Sales recorded through Apr 2026 | ||||||
| Collier | $63.2k | 74 | +5% | −9% | $278k | 38 | −62% |
| Columbia | Sales recorded through May 2026 | ||||||
| DeSoto | Sales recorded through Mar 2026 | ||||||
| Dixie | Sales recorded through May 2026 | ||||||
| Duval | $57.3k | 31 | — | −47% | $60k | 137 | +20% |
| Escambia | $25.7k | 33 | +15% | +140% | $70k | 79 | +23% |
| Flagler | Sales recorded through May 2026 | ||||||
| Franklin | Sales recorded through May 2026 | ||||||
| Gadsden | Sales recorded through May 2026 | ||||||
| Gilchrist | $15k | 33 | — | — | — | 8 | — |
| Glades | Sales recorded through Apr 2026 | ||||||
| Gulf | Sales recorded through May 2026 | ||||||
| Hamilton | Sales recorded through May 2026 | ||||||
| Hardee | Sales recorded through May 2026 | ||||||
| Hendry | $37.6k | 57 | +2% | −3% | $21k | 16 | — |
| Hernando | Sales recorded through May 2026 | ||||||
| Highlands | $23.5k | 65 | +18% | +26% | $16k | 325 | +7% |
| Hillsborough | $114k | 52 | +23% | +25% | $126k | 86 | −42% |
| Holmes | $4,390 | 24 | — | — | — | 4 | — |
| Indian River | Sales recorded through May 2026 | ||||||
| Jackson | Sales recorded through May 2026 | ||||||
| Jefferson | Sales recorded through May 2026 | ||||||
| Lafayette | Sales recorded through Apr 2026 | ||||||
| Lake | Sales recorded through May 2026 | ||||||
| Lee | Sales recorded through Mar 2026 | ||||||
| Leon | $34.5k | 36 | — | −30% | $36.4k | 20 | — |
| Levy | $18.3k | 105 | +4% | +3% | $10.3k | 76 | −7% |
| Liberty | Sales recorded through Mar 2026 | ||||||
| Madison | $9,390 | 46 | +20% | +18% | — | 8 | — |
| Manatee | $185k | 14 | — | — | $84.5k | 48 | −22% |
| Marion | Sales recorded through May 2026 | ||||||
| Martin | $299k | 30 | — | — | $300k | 25 | — |
| Miami-Dade | Sales recorded through May 2026 | ||||||
| Monroe | — | 0 | — | — | $285k | 39 | −14% |
| Nassau | Sales recorded through May 2026 | ||||||
| Okaloosa | Sales recorded through May 2026 | ||||||
| Okeechobee | $20k | 123 | 0% | 0% | $40k | 55 | — |
| Orange | Sales recorded through May 2026 | ||||||
| Osceola | Sales recorded through May 2026 | ||||||
| Palm Beach | Sales recorded through May 2026 | ||||||
| Pasco | $72.8k | 63 | +7% | −1% | $75.7k | 134 | +116% |
| Pinellas | — | 2 | — | — | $250k | 101 | −39% |
| Polk | $25.1k | 96 | −4% | −1% | $47.1k | 280 | +21% |
| Putnam | Sales recorded through May 2026 | ||||||
| Santa Rosa | Sales recorded through May 2026 | ||||||
| Sarasota | $104k | 17 | — | — | $20k | 332 | 0% |
| Seminole | $129k | 15 | — | — | $77.5k | 34 | −14% |
| St. Johns | Sales recorded through May 2026 | ||||||
| St. Lucie | $147k | 26 | — | — | $132k | 194 | 0% |
| Sumter | Sales recorded through May 2026 | ||||||
| Suwannee | $11.8k | 93 | −10% | +8% | $20.5k | 21 | — |
| Taylor | Sales recorded through May 2026 | ||||||
| Union | Sales recorded through May 2026 | ||||||
| Volusia | Sales recorded through Apr 2026 | ||||||
| Wakulla | Sales recorded through May 2026 | ||||||
| Walton | $17.3k | 46 | +2% | −39% | $114k | 170 | −8% |
| Washington | Sales recorded through May 2026 | ||||||
Method
- Recorded arm's-length sales of vacant land, Apr–Jun 2026, from Florida county deed records: the sales the county pages and the monthly market report count.
- A deed of several parcels counts once, and only if every parcel on it is vacant land. A non-farm sale over 3 times its assessed value (a new home on a lot the roll still calls vacant) and acreage under $100 an acre are left out.
- 1+ acre: price per acre of deeds whose parcels average an acre or more. Lots: price per lot of the rest.
- A median needs 10 sales; a change needs 30 sales in both quarters. A county prints Q2 2026 only when its recorded sales reach Jun 2026: a month with under half the sales of the six before it is still being recorded.
- The Florida figures cover the same 28 counties in every quarter.
- Each parcel carries its latest sale, and land built on since it sold is no longer vacant, so older quarters hold somewhat fewer sales than were made.
Questions
What did an acre of vacant land sell for in Florida in Q2 2026?
$27.1k an acre: the median of 1,409 sales of 1 acre or more in the 28 counties whose Q2 2026 sales are fully recorded (−2% on Q2 2025 in the same counties).
Which Florida county had the highest land prices in Q2 2026?
Martin County: a median $299k an acre on 30 sales of 1 acre or more, among the counties with 10 or more such sales.
Why do some counties show no figure?
A county prints Q2 2026 only when its recorded sales reach Jun 2026. A median needs 10 sales and a change needs 30 sales in both quarters.
Sources and dates
County deed records, 67 counties: recorded arm's-length vacant-land sales, Apr 2025–Jun 2026; counted on our map built 2026-10-15; edition built 2026-10-15. Free to cite as “Groundwork (groundworkmap.com)”.
Every edition
- Q2 2026 (Apr–Jun 2026), built Oct 15, 2026