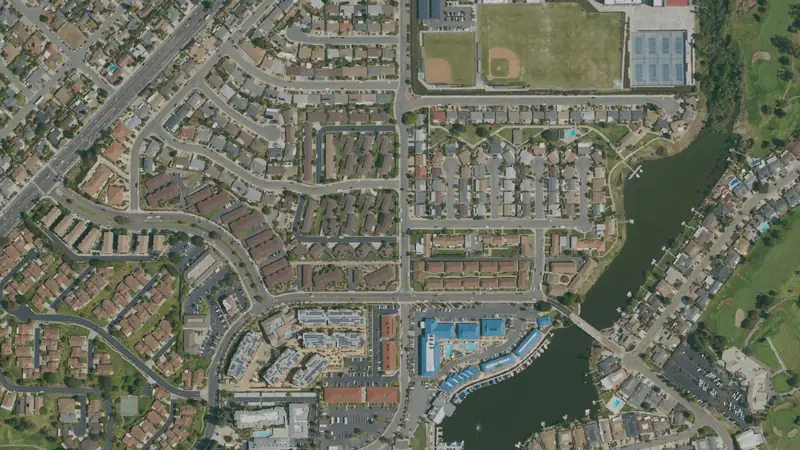
Lake San Marcos, CA land: flood, zoning and parcels
2,674 parcels
7.7% of Lake San Marcos’s 2,674 parcels are in a FEMA flood zone.
Map data Oct 11, 2026
- Acres on the roll893
- In a FEMA flood zone7.7%special flood hazard area
Property tax calendar
California 2026-27 taxes: first installment due by December 10, 2026; second by April 12, 2027; assessment appeals open until November 30, 2026. Pay or check a bill at the San Diego County Treasurer-Tax Collector.
Free account: 25 parcel cards a day on the map, with watches and a saved search. Get started free
Around Lake San Marcos
Parcels to start with
Flood zones and wetlands
Recorded flood claims in Lake San Marcos
Fewer than 10 insured flood claims were recorded in and around Lake San Marcos since 1978.
Storm history
From 1950 through 2025, 27 tornadoes were recorded in San Diego County (NOAA).
- Tornadoes rated F2/EF2 or stronger: 0
- Strongest tornado rating: F1 (8 tornadoes, most recently November 10, 2000)
- Most recent tornado: April 22, 2019
Home value trend in San Diego County
Home values in San Diego County rose about 54% over 5 years and 1% in the last year (FHFA, 2025).
Property tax in Lake San Marcos
Homeowners in Lake San Marcos pay a median of about $4,960 a year in property tax, about 0.54% of what their homes are worth (Census ACS 2020–2024).
California resets a home's taxed value to its price when it sells (Prop 13), so a buyer's yearly bill starts at about 1% of the purchase price plus voter-approved local debt, with direct charges on top; owners who bought long ago pay much less than that, which pulls the share above down.
Development in Lake San Marcos
Little new development inside Lake San Marcos's limits: under 5 acres turned from farmland, forest or other open land into developed land in 2020–2025.
Frost dates and growing zone in Lake San Marcos
Frost is rare: most years bring no freeze at all, so the growing season runs all year. Hardiness zone 10a.
- Days of 90°F or hotter: about 3 a year
- Rain and melted snow: about 11 inches a year
- Weather station: Carlsbad Palomar Airport (NOAA), about 4 miles from the town's center
People and new homes in Lake San Marcos
About 4,693 people live in Lake San Marcos.
- Population4,6932020–2024 average, ±708
- Median household income$89,8512020–2024 average, ±$17,454
Living in Lake San Marcos
In Lake San Marcos, owners valued the typical home at $917,000 and the typical rent with utilities was $2,585 a month (Census survey, 2020–2024).
- Median home value$917,000What owners say their home is worth, 2020–2024 average
- Median rent$2,585 a monthRent plus utilities, 2020–2024 average
- Average commute24 minutesOne way, for workers who travel to work; ±10 minutes, a wide margin (few workers surveyed)
- Work from home23%Of working residents; ±6 points, a wide margin (few workers surveyed)
- Residents with a job1,824Aged 16 and over, counted where they live, not where they work; ±469, a wide margin (few workers surveyed)
Health care near Lake San Marcos
Lake San Marcos is in San Diego County, which is federally designated as short of primary-care doctors (in parts of the county), mental-health providers (in parts of the county) and dentists (for low-income residents, in parts of the county). 13 hospitals with an emergency room are within 30 miles of the center of Lake San Marcos (straight line).
- Primary care shortageGeographic HPSA, part of the county (2 areas); Medicaid Eligible Population HPSA, part of the county (56 areas); Low Income Population HPSA, part of the county (22 areas) (HRSA status: Proposed For Withdrawal)HRSA, last updated Oct 28, 2026
- Mental health shortageGeographic HPSA, part of the county (5 areas); High Needs Geographic HPSA, part of the county (2 areas); Low Income Population HPSA, part of the county (177 areas) (HRSA status: Proposed For Withdrawal)HRSA, last updated Sep 22, 2025
- Dental shortageLow Income Population HPSA, part of the county (69 areas); Medicaid Eligible Population HPSA, part of the county (66 areas)HRSA, last updated Sep 4, 2026
- Emergency rooms within 30 miles13 hospitals · nearest: Kaiser Foundation Hospital - San Marcos (about 2.4 miles); Tri - City Medical Center (about 6.5 miles); Scripps Memorial Hospital Encinitas (about 7.4 miles); and 10 moreStraight line from the center of Lake San Marcos, not road miles or drive time
Land in Lake San Marcos by useLand use on the county roll
| Land class | Parcels | Share |
|---|---|---|
| Building on record | 2,596 | 97% |
| Other or not coded | 69 | 2.6% |
| Farm and timber | 5 | 0.2% |
| Institutional | 3 | 0.1% |
| Vacant residential | 1 | under 0.1% |
5 farm and timber parcels cover 26 acres. County tax roll, as of Oct 2026; land class read from the roll's land-use and building fields.
Typical lot sizeThe typical lot, from the roll
The median parcel in Lake San Marcos is 0.16 acre (1,605 parcels with a size).
Acres from the county roll, or from the parcel's own outline where the roll's figure is off by more than three times. Condominium units that share one point (each carrying the whole complex's acres) are left out of the lot sizes.
How Lake San Marcos is zonedThe most common districts
| Zoning district | Parcels | Share of zoned |
|---|---|---|
| RS | 1,293 | 48% |
| RV | 693 | 26% |
| RU | 209 | 7.8% |
| C34 | 135 | 5% |
| RC | 104 | 3.9% |
| C36 | 84 | 3.1% |
| RR | 77 | 2.9% |
| C31 | 52 | 1.9% |
Zoning is on file for 100% of parcels in Lake San Marcos, across 10 districts. A district shown by its code alone has no published name on our map. The town or county zoning office has the final word on any parcel.
Land parcels in Lake San MarcosLand and farm parcels to start with
Land and farm parcels of an acre or more, each with its own page of public roll facts.
More nearby townsFarther towns around it
Questions about Lake San Marcos landAnswers from the public records
How many parcels are in Lake San Marcos, CA?
2,674 parcels on the San Diego County tax roll (as of Oct 2026) inside the Census Bureau's boundary for Lake San Marcos, which can differ from its own limits at the edges, covering 893 acres.
How much vacant land is in Lake San Marcos, CA?
13,491 parcels are coded vacant, but about 25,000 parcels carry code 100, which the county's published code list doesn't define, so we don't give a vacant total here yet.
What is the typical lot size in Lake San Marcos?
The median parcel is 0.16 acre, from 1,605 parcels with a recorded size.
How much of Lake San Marcos is in a flood zone?
7.7% of parcels are in a FEMA special flood hazard area (National Flood Hazard Layer, as of Oct 2026). Check each parcel's own flood line before you buy.
Are there wetlands in Lake San Marcos?
0.4% of parcels are a quarter or more wetland on the USFWS National Wetlands Inventory, a mapping guide, not a legal delineation.
What is Lake San Marcos zoned?
Zoning is on file for 100% of parcels. The most common districts: RS, RV, RU.
Are there land prices for Lake San Marcos?
No land-price range is shown for Lake San Marcos yet. We have no sale-price file for San Diego County yet.
How many people live in Lake San Marcos?
About 4,693 on average over 2020–2024 (Census American Community Survey 5-year).
What is the property tax rate in Lake San Marcos?
Homeowners in Lake San Marcos pay a median of about $4,960 a year in property tax, about 0.54% of what their homes are worth (Census ACS 2020–2024). California resets a home's taxed value to its price when it sells (Prop 13), so a buyer's yearly bill starts at about 1% of the purchase price plus voter-approved local debt, with direct charges on top; owners who bought long ago pay much less than that, which pulls the share above down. It is an area median, not any one property's bill.
Does it frost in Lake San Marcos?
Rarely: most years bring no freeze at all, so the growing season runs all year (NOAA 1991–2020 normals, Carlsbad Palomar Airport station).
How many tornadoes have been recorded in San Diego County?
27 tornadoes were recorded in San Diego County from 1950 through 2025 (NOAA). The most recent was on April 22, 2019.
Where does this data come from?
Parcels: GIS data derived, modified, reduced, and/or processed from SanGIS downloadable data - www.sangis.org Copyright SanGIS 2009. Not an original SanGIS product; not for insurance underwriting.. Flood: FEMA National Flood Hazard Layer. Wetlands: USFWS National Wetlands Inventory. Towns: U.S. Census places. Every figure is counted from those files on our map.
More in San Diego CountyIts other towns
Sources & methodSources, dates and how these figures are built
Headline figures: source and date
Acres on the roll: County tax roll, counted on our map built Oct 11, 2026.
In a FEMA flood zone: FEMA National Flood Hazard Layer, as of Oct 10, 2026; counted on our map built Oct 11, 2026.
Property tax due dates
California Revenue and Taxation Code 2617, 2618, 2619 and 1603; the State Board of Equalization’s 2026 appeal filing periods. Checked Oct 13, 2026.
Flood zones and wetlands: source and date
FEMA flood zone (A or V): FEMA National Flood Hazard Layer, as of Oct 10, 2026; counted on our map built Oct 11, 2026.
Parcels at least 25% wetland: USFWS National Wetlands Inventory, as of Oct 9, 2026; counted on our map built Oct 11, 2026.
Recorded flood claims in Lake San Marcos
FEMA counts claims on buildings with NFIP flood insurance, so land without an insured building never shows here. Claims counted from 1978 to Sep 2026.
Source: OpenFEMA NFIP Redacted Claims v3, as of Sep 2026.
Counted in the 3 census block groups that lie mostly inside Lake San Marcos, so the edges may reach past the town line.
Storm history
Hurricanes and tropical storms: the National Hurricane Center's final storm tracks for the 1950–2025 seasons. A storm counts when its center came within 50 miles of San Diego County's boundary. NHC records a storm's position every six hours; the path between those points is filled in with straight steps every ten minutes. A storm counts as a hurricane if it was one (winds of 74 mph or more) while within 50 miles, otherwise as a tropical storm (39 mph or more; subtropical storms included). A storm that had already lost its tropical status is not counted. A storm's status (hurricane, tropical storm or neither) holds until NHC's next position records a change. The category is the Saffir-Simpson category at the storm's highest wind within 50 miles.
Tornadoes: the Storm Prediction Center's tornado records, 1950–2025. Each tornado counts once for a county when SPC lists that county for it or its recorded path (a straight line from touchdown to lift-off) crosses the county. Ratings use the Fujita scale (F) before February 2007 and the Enhanced Fujita scale (EF) since; tornadoes with no rating are left out of the rating figures.
These are counts of past storms, not a forecast. They are a different measure from federal disaster declarations, which name every county a storm affected, wherever its center went.
Sources: NOAA National Hurricane Center, HURDAT2 best tracks (Atlantic and Northeast Pacific files, through 2025); NOAA Storm Prediction Center, Severe Weather Database (tornadoes) (through 2025). Public domain.
Home value trend in San Diego County
This tracks home values, not land values. Land buyers read it as a sign of demand nearby: where homes gain value, builders and buyers follow. A vacant lot can move differently.
How: the change in FHFA's annual county index from 2020 and 2024 to 2025, rounded. The index follows repeat sales and refinance appraisals of the same single-family homes with Fannie Mae or Freddie Mac mortgages. It is in today's dollars, not adjusted for inflation, and FHFA calls these local indexes developmental. Where FHFA's sample is too small it publishes no figure, and none prints here.
Source: FHFA House Price Index, all-transactions, annual county index, 2025, last updated March 31, 2026. Method: Bogin, Doerner and Larson, “Local House Price Dynamics: New Indices and Stylized Facts”, FHFA Working Paper 16-01.
FHFA publishes no index for Lake San Marcos itself; this is San Diego County's, which includes it.
Property tax in Lake San Marcos
This is an area figure, not any one property's bill. A parcel's own tax depends on its taxable value, its exemptions and the taxing districts it sits in; parcel pages estimate that separately where the county publishes what is needed.
How: the Census place's median yearly property-tax bill divided by its median home value, both for owner-occupied homes (about 1,581 here) as owners report them in the Census Bureau's American Community Survey, 2020–2024. Owners estimate their home's value, and the survey has a margin of error; we show the figure only where the area has at least 250 owner-occupied homes and the margin is narrow. Median bill $4,960; median home value $917,000.
Source: Census ACS 2020–2024 5-year, tables B25103 and B25077, released January 2026.
Counted for the Census place of Lake San Marcos (inside its limits or, for an unincorporated place, its Census boundary).
Development in Lake San Marcos
Counted inside the Census place boundary of Lake San Marcos CDP. Counted from USGS Annual NLCD land cover (2015, 2020 and 2025; 30 m squares on a 240 m grid, so edges are approximate). A square counts when it was forest, shrub, grassland, pasture, cropland or wetland in the start year and developed in 2025 (NLCD's developed classes, from lawns and roads to dense buildings). A satellite land-cover map misses some changes and mislabels a few; read it as a guide.
Source: USGS Annual NLCD Collection 1.2, public domain, DOI 10.5066/P94UXNTS.
Climate and growing season
How: the frost dates are NOAA's 50% dates for 32°F: in half of the years 1991–2020 the last spring frost came before the first date, and in half the first fall frost came before the second (a date in January or February means the following winter). The growing season is NOAA's typical count of frost-free days, worked out year by year, so it can differ by a few days from the gap between the two dates (by more where frost is rare). Hot days, rain (with melted snow) and snowfall are 1991–2020 yearly averages. A town's station is the nearest NOAA station within 25 miles whose winter lows match the place's (within 5°F on the hardiness map's coldest-night figure), so a valley station is not used for a hilltop town. A low spot or a hillside on your own land can frost earlier or later.
Hardiness zone: the 2023 USDA map, which sorts places by the average coldest night of the year (1991–2020) into 10°F zones split into 5°F halves. It is read at the town's center (the Census Bureau's point for the place).
Sources: NOAA NCEI U.S. Climate Normals, 1991–2020 (Carlsbad Palomar Airport, station USW00003177, 328 ft); USDA Plant Hardiness Zone Map, 2023 (USDA Agricultural Research Service and Oregon State University PRISM). Compiled October 30, 2026.
People and new homes in Lake San Marcos
U.S. Census Bureau, American Community Survey 2020-2024 5-year (B19013) (Jan 2026).
Living in Lake San Marcos
Source: U.S. Census Bureau, American Community Survey 2020-2024 5-year estimates (tables B01003, B19013, B25077, B25064, B08013, B08012, B08301), Census Summary File.
ACS figures are survey averages over five years (money in 2024 dollars), not a count. Home value is what owners told the Census their home would sell for, not a market estimate, so it can sit below Groundwork’s single-family estimates, which follow recent sales. ± is the Census 90% margin of error; a figure whose margin is more than about half its size (a CV over 30%) is not shown. The average commute is total travel time divided by the workers who travel to work, as Census computes it. Places under 2,500 people show no figures.
Census figures for the whole place of Lake San Marcos, inside its Census boundary.
Health care near Lake San Marcos
Shortage designations: HRSA Health Professional Shortage Areas (primary care, mental health, dental), HRSA data, as of October 2026. Hospitals: CMS Care Compare hospital list (hospitals that report an emergency department), July 2026, located by the U.S. Census Bureau geocoder or, where it found no match, the USGS National Structures Dataset hospital point; distances from the Census Bureau's center point of the county or town (2024 Gazetteer).
A Health Professional Shortage Area (HPSA) is the federal government's finding that an area, or a group of people in it, has too few primary-care doctors, dentists or mental-health providers for its population. A geographic designation covers everyone in the area; a population designation (for example “Low Income Population HPSA”) covers only that group. Some designations cover only some census tracts or county subdivisions (the “areas” counted). The designation types and statuses are HRSA's own words; a designation HRSA has proposed for withdrawal stays on its list until it is withdrawn, and only designations with status “Designated” are in the summary sentence. A designation is about how many providers there are, not the quality of care. Hospitals counted are acute-care, critical-access and rural emergency hospitals that report an emergency department to Medicare, under the name filed with Medicare or the hospital's current name; one Medicare listing can cover more than one campus. Veterans', military, children's and psychiatric hospitals are not counted, and no ratings are shown.
The shortage designations are San Diego County's; the hospital count is measured from the Census center point of Lake San Marcos.
Sources
Parcels: GIS data derived, modified, reduced, and/or processed from SanGIS downloadable data - www.sangis.org Copyright SanGIS 2009. Not an original SanGIS product; not for insurance underwriting. (roll as of Oct 2026); flood: FEMA National Flood Hazard Layer (as of Oct 2026); wetlands: USFWS National Wetlands Inventory (as of Oct 2026); town limits: U.S. Census Bureau TIGER/Line places; counted on our map built Oct 2026.
Derived from SanGIS data; not for use in insurance underwriting.
This product uses the Federal Emergency Management Agency's OpenFEMA API, but is not endorsed by FEMA. The Federal Government or FEMA cannot vouch for the data or analyses derived from these data.